

Last Updated: January 2026
—
Introduction
Slack has become a standard business chat tool in Japan. Since you can easily try it from the free version, many people have likely experienced Slack at some point.
In today’s remote work era, when comparing various tools, you might notice that Slack is “easy to use, but somewhat lacking.” Despite this, why does Slack’s popularity remain strong?
This article is for those who tried Slack and found it inconvenient, or those who would like to continue using Slack if only certain complaints could be resolved. We’ll share Slack’s advantages and disadvantages, along with tips for using it effectively.
—
Background of Increasing Slack Adoption in Companies
Slack’s adoption grew in companies because it matched the era’s demand for flexible communication methods to replace email. Additionally, Slack gained high praise from frontline users, and as it was actually used, trust in the tool increased.
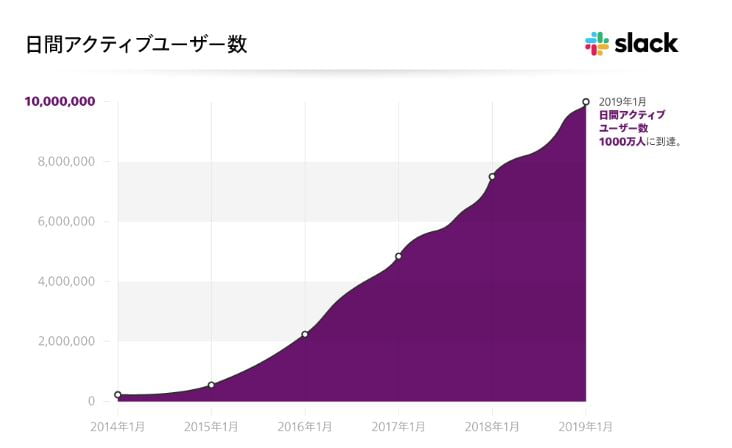
*Source: https://slack.com/intl/ja-jp/blog/news/slack-has-10-million-daily-active-users*
Surge in Communication Tool Demand Due to Increased Remote Work
In Japan, many companies suddenly implemented remote work as a measure to prevent the spread of COVID-19 through office attendance restrictions.
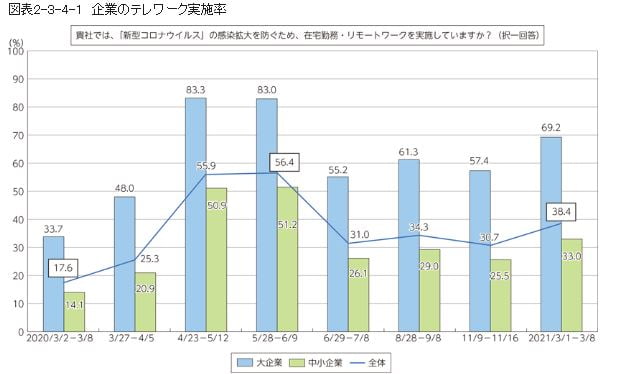
*Source: https://www.soumu.go.jp/johotsusintokei/whitepaper/ja/r03/html/nd123410.html*
As a result of starting remote work hastily without sufficient preparation, communication problems became apparent: “Unable to handle detailed exchanges, reporting stalls,” “Can’t see subordinates’ situations, making management difficult.”
To enable real-time communication during remote work, business chat tools gained attention, and tools like Slack were adopted in succession.
—
Advantages of Slack
Slack earns high praise as a business chat tool because of its unique strengths. Here are Slack’s advantages that set it apart from other tools.
Strong External Tool Integration
Slack’s strength lies in external tool integration. By connecting apps you regularly use to Slack, you can open them directly within Slack or receive notifications.
No need to switch between multiple apps—completing everything in Slack is convenient. The “Slack App Directory” where you can search and add apps has over 2,000 registered applications.
Major Apps That Can Integrate with Slack:
| Category | Main Compatible Apps |
|---|---|
| Task/Schedule Management | Google Calendar, Trello |
| Cloud Storage | Google Drive, Dropbox |
| Gmail, Outlook | |
| Sales Support Tools (SFA) | Salesforce, Senses |
| MA Tools | Marketo |
| SNS |
Multi-Device Support
Slack supports major operating systems and browsers for both computers and smartphones. You can log into multiple devices with one account, allowing you to use your computer at the office and smartphone when out—switching based on your situation.
Chat content syncs across all devices, so you can rest assured.
| Platform | Supported |
|---|---|
| Desktop App | MacOS, Windows, Linux |
| Mobile App | iOS, Android |
| Web Browser | Google Chrome, Firefox, Safari, Microsoft Edge |
*Note: Slack Call-compatible browser is Google Chrome only. Huddle Meeting-compatible browsers are Google Chrome and Firefox only.
Topic-Based Channel Creation and Thread Organization
Continuing all exchanges in one chat makes various topics mix together and become hard to read.
That’s where channels come in. By creating channels for each project or topic, you can quickly access important information without being overwhelmed by irrelevant information.
You can avoid endlessly seeing conversations that don’t concern you or having necessary information get buried.
Furthermore, “thread” display helps avoid message clutter within channels. Using the “reply in thread” feature for specific messages groups related discussions into a thread.
When there are posts in threads you’ve joined or been mentioned in, you’ll receive notifications, so you won’t miss updates in ongoing conversations.
Rich Variety of Emojis
Emojis that can softly convey emotions and nuances without words have become essential in text communication. Slack also offers abundant emojis. You can even create and register your own emojis.
Additionally, you can input emojis using “:(colon)” + “emoji code,” allowing emoji input without switching to the mouse while typing messages.
—
What Are Slack’s Disadvantages?
Slack is an easy-to-use, well-balanced tool, but when you actually use it, there are aspects that feel somewhat lacking.
Voice/Video Call Participant Limits
Slack Call (voice/video) participation is limited to 1-on-1 only on the free plan. If your team wants to make group calls, a paid plan is required.
Paid plan Slack Calls support up to 15 people maximum. Compared to other tools, this isn’t exactly generous.
If you don’t need to use cameras, Huddle Meetings support up to 50 people.
Inconvenient as a Meeting Tool
When using Slack Call or Huddle Meetings for web meetings, you’ll notice various limitations:
Slack can be used for “quick calls,” but it’s somewhat unsuitable for proper “web meetings.”
For large-scale meetings, scheduling, or individual member invitations, you’ll need to use a separate meeting tool.
Difficult to See Others’ Status

Slack displays Active (online)/Away status, but this alone doesn’t reveal how busy someone is.
You can see someone is logged into Slack, but they might be overwhelmed with work or in a web meeting and unable to respond. Since you can’t tell from your end, it’s hard to judge whether you can reach out to them now.
You can display custom status, but it requires each person to update it each time, which is somewhat inconvenient.
Poor Cost-Efficiency for Large User Counts
Switching to a paid plan removes limits on message history and app integrations, and allocates file storage based on user count.
However, group call participation remains at 15 people maximum even on the highest tier plan.
Even if you’re paying monthly fees for 100 or 200 people, not everyone can have a conversation simultaneously.
The larger the organization’s scale, the less value you receive relative to the price, resulting in poor cost-efficiency.
Slack Plan Pricing Per User:
| Plan | Free | Pro | Business+ | Enterprise Grid |
|---|---|---|---|---|
| Monthly (excl. tax) | ¥0 | ¥850 | ¥1,600 | Contact us |
—
3 Solutions to Slack’s Disadvantages
When you feel Slack’s disadvantages, are there solutions? Here are three ideas to resolve Slack’s disadvantages.
1. Upgrade to Slack’s Paid Plan
If you’re currently using Slack on the free plan and feel inconvenienced by user limits, storage capacity, or feature restrictions, some issues can be resolved by upgrading to a paid plan.
However, while this is effective for increasing limits or removing restrictions on existing features, upgrading to a paid plan won’t solve issues if you’re seeking features that Slack doesn’t have at all.
Advantages:
Disadvantages:
Slack Plan Feature Comparison:
| Feature | Free | Pro | Business+ | Enterprise Grid |
|---|---|---|---|---|
| Message History | Latest 10,000 | Unlimited | Unlimited | Unlimited |
| App Integration | Up to 10 | Unlimited | Unlimited | Unlimited |
| File Storage | 5GB total | 10GB/member | 20GB/member | 1TB/member |
| Slack Call | 1-on-1 only | Max 15 | Max 15 | Max 15 |
| Huddle Meeting | × | ○ | ○ | ○ |
| Screen Share | × | ○ | ○ | ○ |
| Slack Connect | × | ○ | ○ | ○ |
| Workflow | × | ○ | ○ | ○ |
| SSO | × | × | ○ | ○ |
2. Switch to Another Tool
If you’re dissatisfied with Slack’s features or usability, considering switching to another tool is one option.
However, finding an ideal tool that meets all your desired conditions can be quite difficult. If you try to complete everything in one tool, inevitably only high-functionality, high-cost tools become options.
Also, when changing from Slack to another tool, you need to review operations for tasks that used Slack and relearn how to operate from scratch, creating significant burden for both administrators and users.
Advantages:
Disadvantages:
3. Use Complementary Tools with Slack
This method keeps using your current Slack while supplementing missing parts with other tools.
Continue using Slack as before, and find tools to accomplish what Slack can’t do.
Since you’re not completely replacing Slack, there’s no stress of tool replacement. You don’t need to find one perfect tool that meets all conditions—you can freely combine tools with the features you need.
While there’s the disadvantage of operating more tools, tools that support Slack integration can be incorporated into Slack.
Since external tool integration is Slack’s advantage, using other tools to strengthen weak areas is arguably the best way to use it.
Advantages:
Disadvantages:
—
VoicePing: A Virtual Office That Complements Slack’s Disadvantages
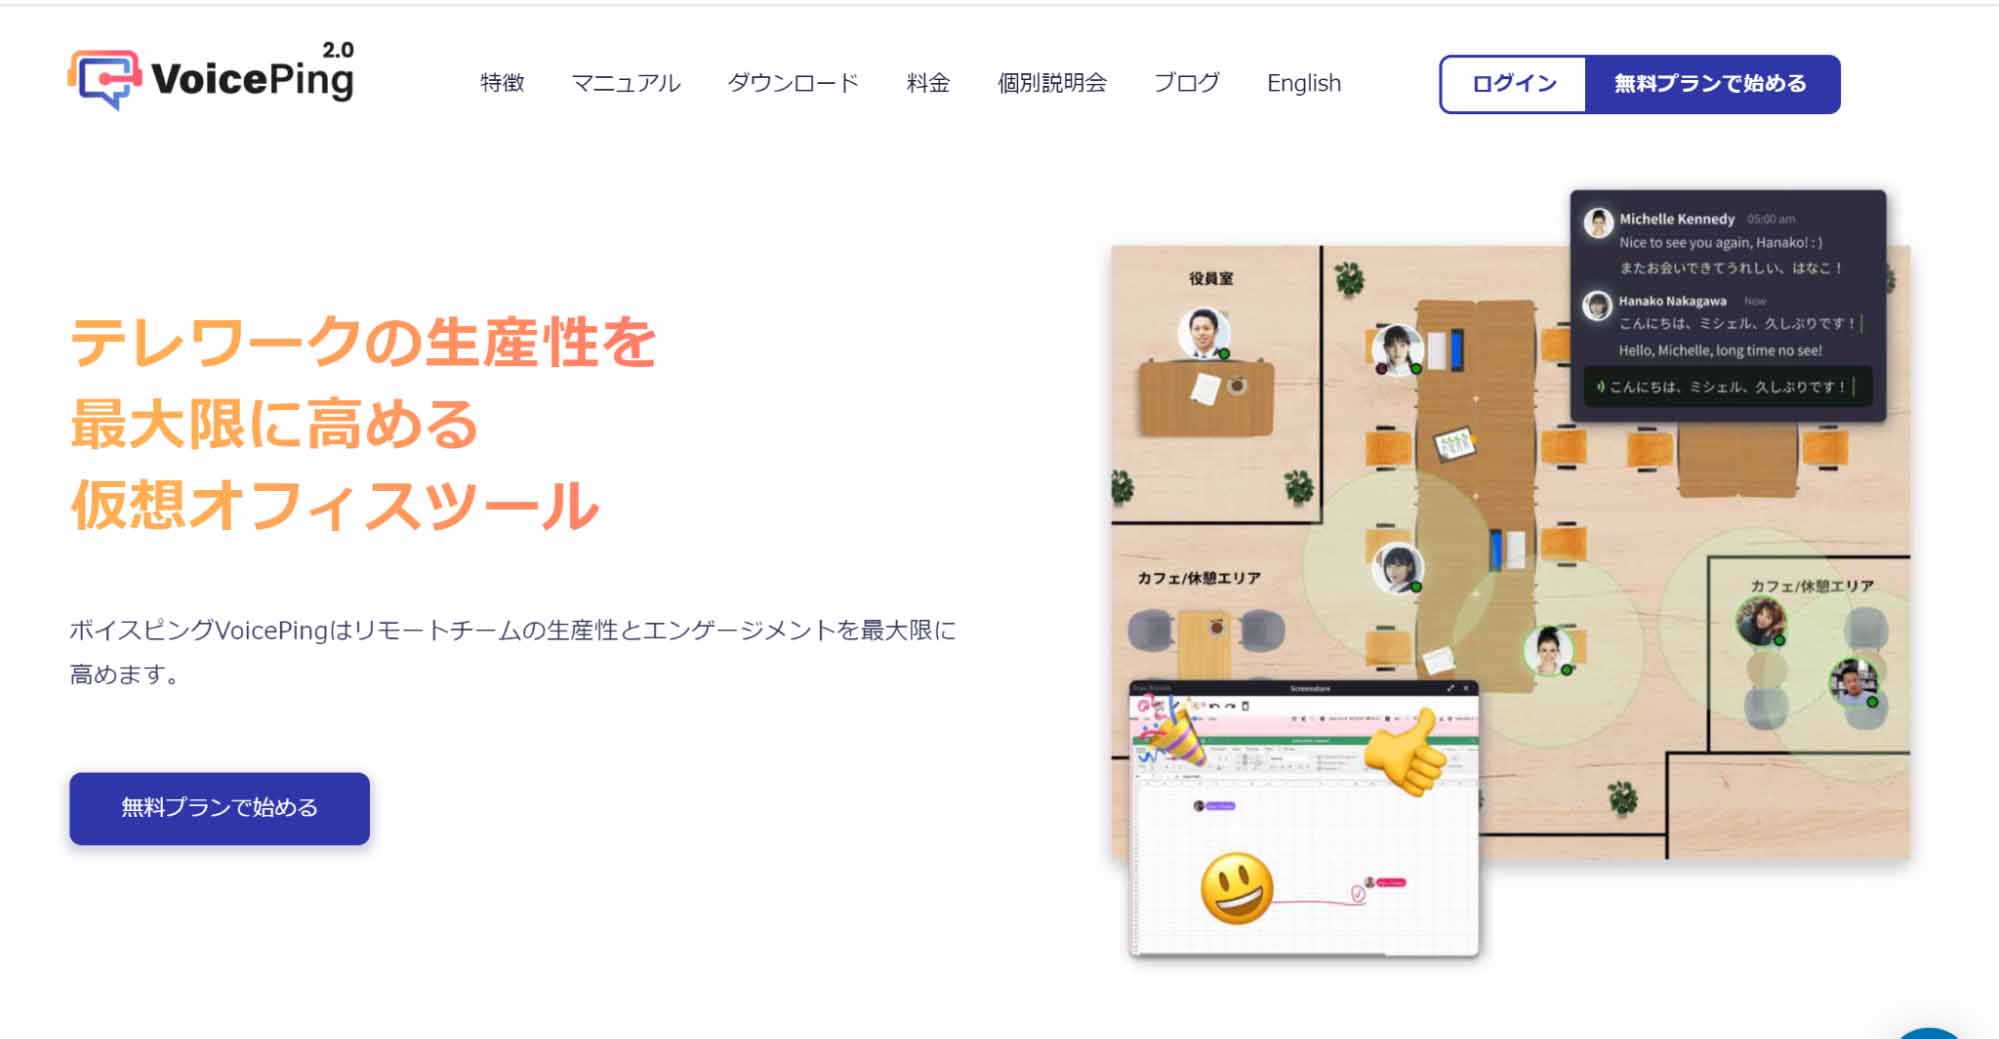
*Source: https://voice-ping.com/*
If you “like Slack but find the web meeting features somewhat lacking,” the virtual office tool “VoicePing” might solve your concerns.
High Simultaneous Connection Capacity
VoicePing allows creating 5 accounts even on the free plan, with up to 10 people including guests connecting simultaneously.
For small team meetings, the free plan provides sufficient coverage.
Paid plans offer plans that expand simultaneous connection capacity at affordable prices.
No URL Sharing Required—One-Click Meeting Invitations
Usually, you can freely converse with members on the virtual office floor, but when you want to start a meeting, you can smoothly transition with one click.
Once in the meeting room, just click members from the list to complete the invitation. When members accept, the meeting starts.
During meetings, you can deploy multiple tools on screen for collaborative work.
Cloud Recording Even on Free Plan
With web meeting tools, cloud recording often only comes with paid plans.
VoicePing allows recording up to 1 hour × 5 times even on the free plan. Since recording data is cloud-stored, sharing with other members is easy.
Slack Transcription Integration Feature
One benefit of using VoicePing with Slack is “transcription feature Slack integration.”
You can sync meeting auto-transcription to Slack channels in real-time.
AI-powered auto-transcription is highly accurate and precise.
Members not present can open Slack on their smartphone to follow the meeting flow in real-time.
Status and Activity Visible at a Glance
In VoicePing, online status is always displayed at the bottom-right of icons, making it easy to see others’ status at a glance.
There are three status types: “Online,” “Busy,” and “Away.”
When you’re logged in but don’t want to be disturbed, setting “Busy” provides peace of mind.
“Away” automatically switches when it detects idle time with no PC operation, so there’s no forgetting to switch.
Additionally, the apps members are currently using are displayed, so you can gauge others’ situations and decide whether to approach them.
Best Cost-Performance with 4 Plans
VoicePing’s plans are priced by account count, allowing waste-free plan selection based on team size.
The “Enterprise Plan” available for organizations of 51+ members offers unlimited simultaneous connections and unlimited cloud recording for just ¥500 per person—an exceptionally valuable plan found nowhere else.
VoicePing Pricing:
| Plan | Simultaneous Connections | Monthly Price (excl. tax) |
|---|---|---|
| Free | Max 10 (5 guests) | ¥0/month |
| Small | Max 30 (15 guests) | ¥7,500/month |
| Premium | Max 100 (50 guests) | ¥20,000/month |
| Enterprise | Unlimited | ¥500/person/month |
—
Resolve Slack’s Disadvantages
Slack’s characteristic is functioning as a collaboration hub that integrates with external tools to aggregate all information on Slack. In other words, Slack alone isn’t perfect—it’s Slack with external tools that makes it complete.
To resolve Slack’s disadvantages, find the optimal tools for your needs.
—
Tags: Slack Disadvantages, Business Chat Tools, Virtual Office, Remote Work, VoicePing